Raster Operation Exploration
This lab uses several raster operation methods to find the crop and land use change after / before and after Hurricane Katrina.
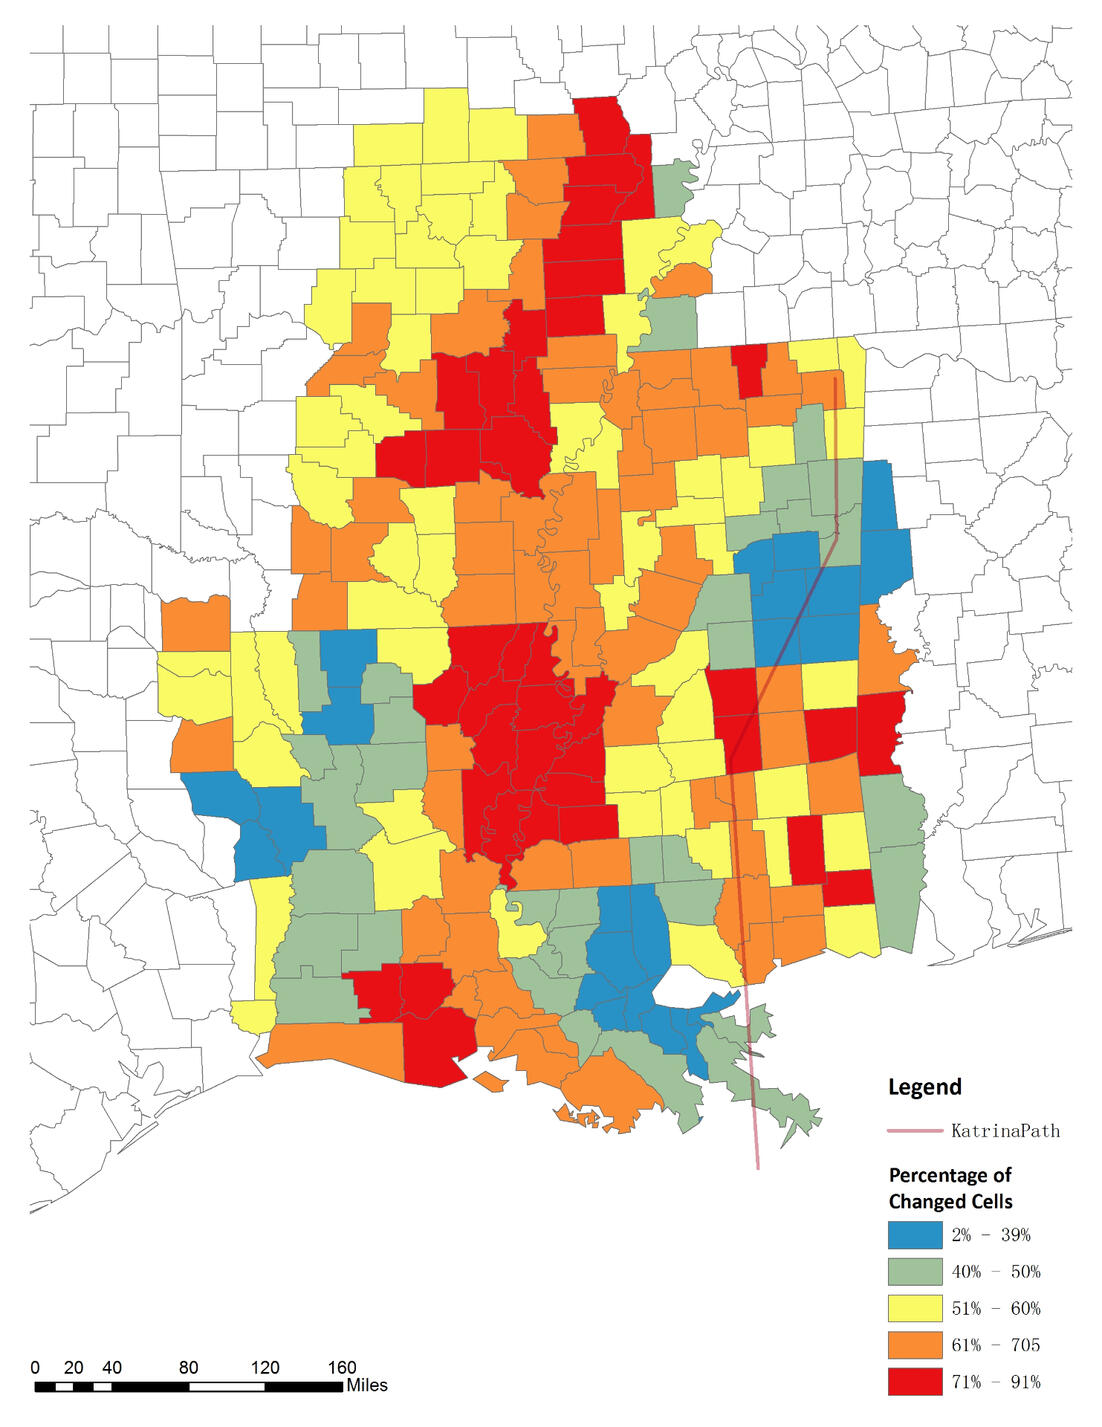
Normal yearly change at county level
Change after Katrina hurricane at county level
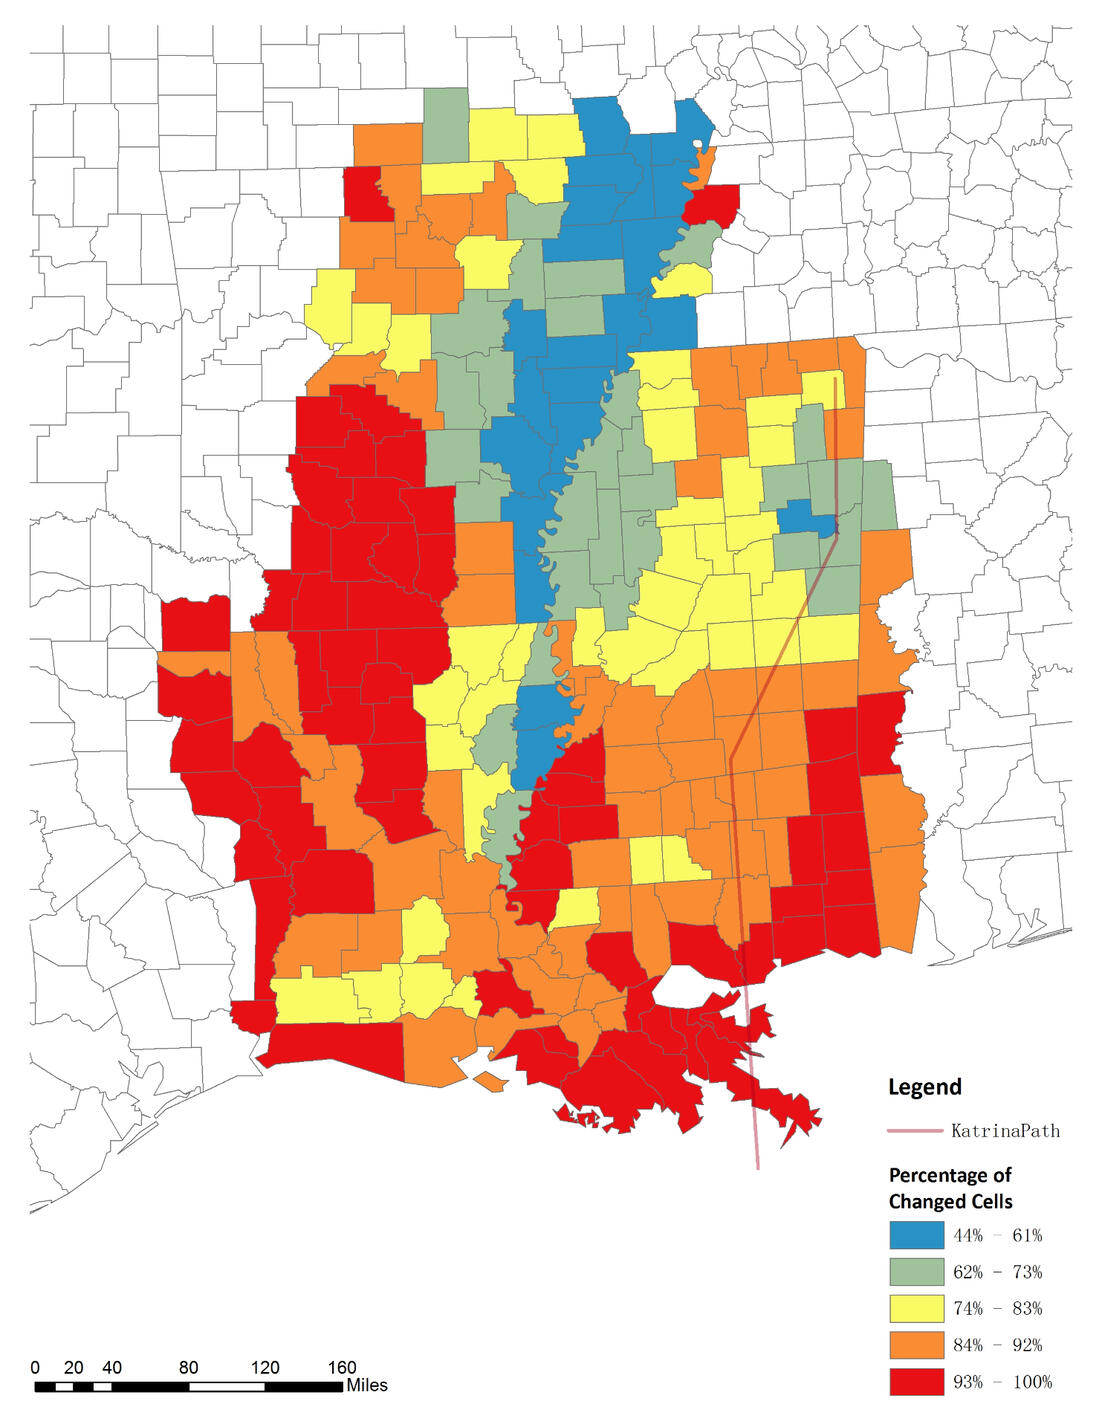
In these two pictures, we can see that Hurricane Katrina has caused great damage to the agriculture in this area, especially counties in the southern hurricane landing zone. In areas where crop production was relatively stable in previous years, that is, such as the western and southern regions, dramatic vegetation changes occurred due to hurricane crossings, shown in the Graphic2. And through observation on Legends we could tell that the percentage of changed raster cells had increased a lot, the smallest number in Graphic2, 44%, would be around the middle of Graphic1, this also indicates that the Hurricane Katrina strongly affected this region.